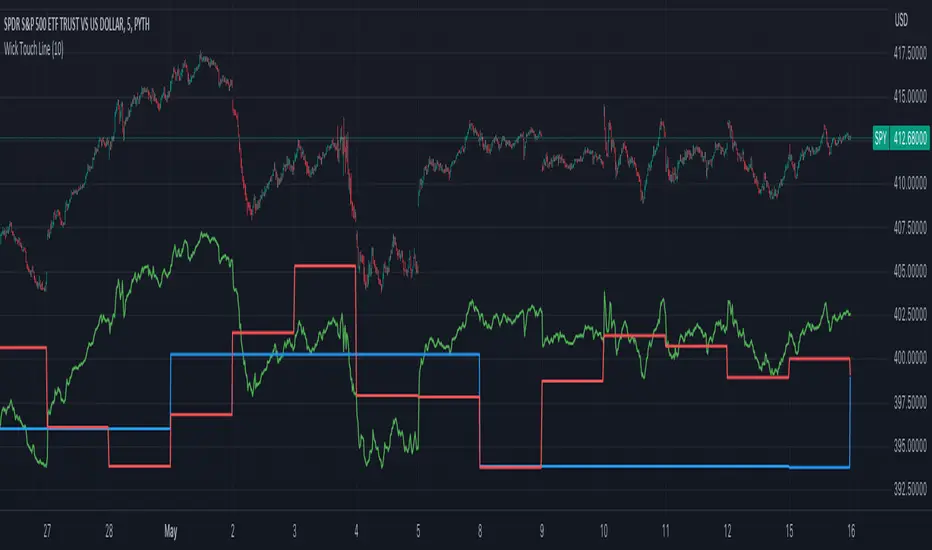
Candle Wick Retest [UkutaLabs]█ OVERVIEW
The Candle Wick Retest Indicator identifies untested wicks in real time that occur when there is an imbalance in the number of buyers and sellers at a price-level. This imbalance occurs when a market exchange receives too many of one kind of order, and not enough of its counterpoint.
Candle Wick Retest is a powerful trading indicator that will automatically identify and label strong ranges on traders’ charts that can be incorporated into a wide variety of different trading strategies.
█ USAGE
The script automatically identifies and measures real-time ranges of imbalance between buying and selling pressure in the market using real-time price-action information. These levels indicate potential Supply and Demand zones which serve to help the trader identify areas where price has changed direction in the past due to an imbalance of buyers and sellers.
The script also allows users to mirror higher time frame Candle Wick Retests onto lower time frame charts to gain a stronger understanding of key levels on another scale.
█ SETTINGS
Configuration
- Show Labels: Determines whether or not identification labels are drawn on the chart.
- Max CW Display: Determines the number of Candle Wick Retests that will be drawn on the chart. This is for each higher timeframe option that is toggled, not the total.
Current Time Frame
- Wick Retest (On/Off): Determines whether wick retests will be drawn from the current time frame chart.
- Wick Retest Bullish Color: Determines the color of bullish wick retests from the current time frame.
- Wick Retest Bearish Color: Determines the color of bearish wick retests from the current time frame.
5 Minute (Higher Timeframe)
- Wick Retest (On/Off): Determines whether wick retests will be drawn from the 5 minute chart.
- Wick Retest Bullish Color: Determines the color of bullish wick retests from the 5 minute time frame.
- Wick Retest Bearish Color: Determines the color of bearish wick retests from the 5 minute time frame.
15 Minute (Higher Timeframe)
- Wick Retest (On/Off): Determines whether wick retests will be drawn from the 15 minute time frame chart.
- Wick Retest Bullish Color: Determines the color of bullish wick retests from the 15 minute time frame.
- Wick Retest Bearish Color: Determines the color of bearish wick retests from the 15 minute time frame.
30 Minute (Higher Timeframe)
- Wick Retest (On/Off): Determines whether wick retests will be drawn from the 30 minute time frame chart.
- Wick Retest Bullish Color: Determines the color of bullish wick retests from the 30 minute time frame.
- Wick Retest Bearish Color: Determines the color of bearish wick retests from the 30 minute time frame.
60 Minute (Higher Timeframe)
- Wick Retest (On/Off): Determines whether wick retests will be drawn from the 60 minute time frame chart.
- Wick Retest Bullish Color: Determines the color of bullish wick retests from the 60 minute time frame.
- Wick Retest Bearish Color: Determines the color of bearish wick retests from the 60 minute time frame.
240 Minute (Higher Timeframe)
- Wick Retest (On/Off): Determines whether wick retests will be drawn from the 240 minute time frame chart.
- Wick Retest Bullish Color: Determines the color of bullish wick retests from the 240 minute time frame.
- Wick Retest Bearish Color: Determines the color of bearish wick retests from the 240 minute time frame.
Daily (Higher Timeframe)
- Wick Retest (On/Off): Determines whether wick retests will be drawn from the daily time frame chart.
- Wick Retest Bullish Color: Determines the color of bullish wick retests from the daily time frame.
- Wick Retest Bearish Color: Determines the color of bearish wick retests from the daily time frame.
Cari skrip untuk "key levels"

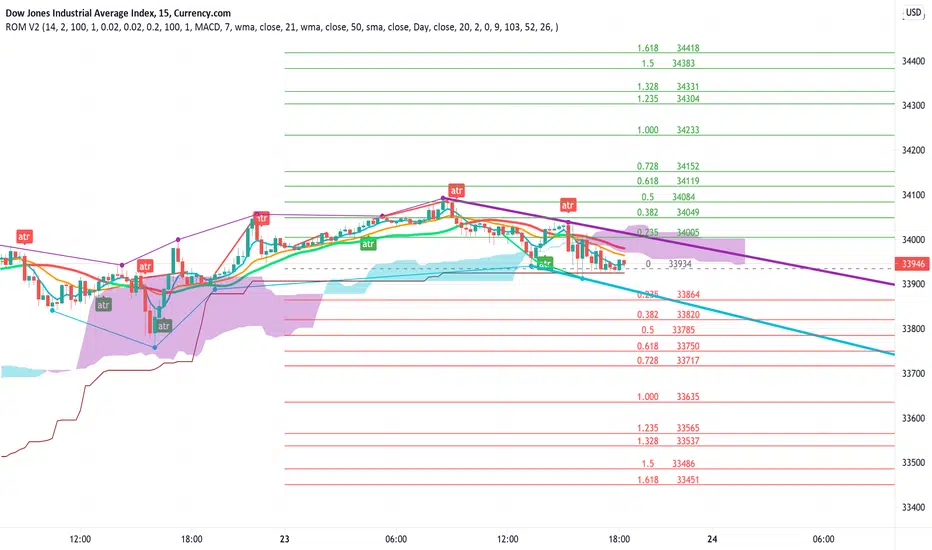
MonkeyblackmailThis script consists of several sections. test it and tell me your concerns. a lot of more works will be done
Volume Accumulation : The first part of the script checks for a new 5-minute interval and accumulates the volume of the current interval. It separates the volume into buying volume and selling volume based on whether the closing price is closer to the high or low of the bar.
Volume Normalization and Pressure Calculation : The script then normalizes the volume with a 20-period EMA, and calculates buying pressure, selling pressure, and total pressure. These calculations provide insight into the underlying demand (buying pressure) and supply (selling pressure) conditions in the market.
RSI Calculation and Overbought/Oversold Conditions : The script calculates the RSI (Relative Strength Index) and checks whether it is in an overbought (RSI > 70) or oversold (RSI < 30) state. The RSI is a momentum indicator, providing insights into the speed and change of price movements.
Volume Condition Check and Wondertrend Indicator : The script checks if the volume is high for the past five bars. If it is, it applies the Wondertrend Indicator, which uses a combination of the Parabolic SAR (Stop and Reverse) and Keltner Channel to identify potential trends in the market.
Swing High/Low and Fibonacci Retracement : The script identifies swing high and swing low points using a specified pivot length. Then, it draws Fibonacci retracement levels between these swing high and swing low points.
he monkeyblackmail script works well in the 5 minutes chart and combines several elements of technical analysis, including volume analysis, momentum indicators, trend-following indicators, volatility channels, and Fibonacci retracements. It aims to provide a comprehensive view of the market condition, highlighting key levels and potential trends in an easily understandable format. Don’t be too quick to start trading with it, first study how it work and you will blackmail the market.

28 Levels V0.1V 0.1
Daily, weekly and monthly important key levels for trading options.
FYI: Not fully functional. It will take ongoing effort to complete the algo.
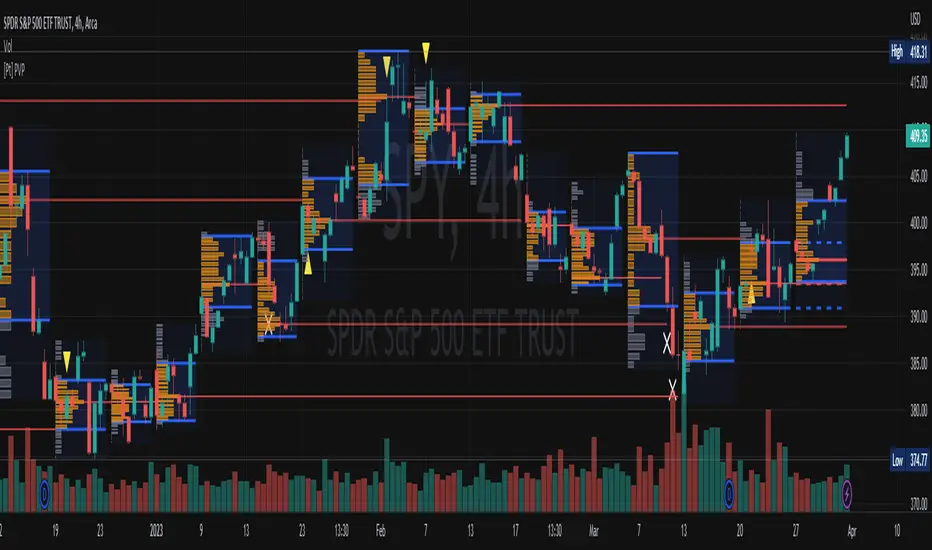
[Pt] Periodic Volume ProfileThis script is an attempt to recreate the Periodic Volume Profile that is built-in by TradingView, with slightly different features. Related blog: www.tradingview.com
This script is based on another script "Volume Profile, Pivot Anchored" by @dgtrd
*Note that only limited number Volume Profile can be displayed on the chart due to limitations on displaying boxes and lines.
Description
This Periodic Volume Profile (PVP) indicator allows trades to view volume profiles for periods longer than the current timeframe. The indicator builds one general volume profile for each new period, set by the user through the “Periodic Timeframe” input parameter.
This script also has the option to extend Point of Control (POC) lines with optional end conditions: Until Bar Touch, Until Last Bar, Until Bar Cross, or None, which extends to the right.
Signals are generated for Naked POC touches and crosses by a triangle symbol and a cross symbol, by default.
Alerts are available for POC touches and crosses.
What is Volume Profile?
Volume profile is a technical analysis tool that shows the volume of trades at different prices for a given security or market over a specific period of time.
Volume profile can be used to identify key levels of support and resistance, as well as to assess the overall supply and demand for a security. For example, if there is a high volume of trades at a particular price level, this may indicate that there is a significant level of support or resistance at that price. On the other hand, if there is relatively low volume at a particular price, this may indicate that there is not much interest in trading at that level.
Traders can use volume profile to identify trends, make trading decisions, and set stop-loss and take-profit orders. It can also be useful for identifying patterns such as "pockets of liquidity," which are areas where there is a high volume of trades but relatively little price movement.
It is important to note that volume profile should be used in conjunction with other technical analysis tools and should not be relied upon in isolation. It is also important to consider the overall context and market conditions when interpreting volume profile data.
Key Difference with TradingView's PVP indicator - TradingView's PVP intraday period does not align with standard intraday timeframes as it is determined by # of bars. This script provides volume profiles that aligns with higher timeframe periods.
Enjoy~!
Directional Movement RibbonWhat makes this different from directional movement index?
The aim is to reduce the amount of data analysis necessary before taking action; currently using DMI requires reviewing the DM+ and DM- plots, and ADX as well as review the overall trend of each one. Also there is the final analysis to determine whether a strong trend hasn’t been established at all.
This indicator condenses the information found from the standard DMI into an intuitive colored ribbon that reveals direction and strength at a glance.
How to use it?
Review the ribbon for sentiment based on color, green being bullish and red being bearish, (if using default color scheme). The brightness of the color determines the strength of the sentiment, brightest being strongest. If no color is represented at all then it is due to weakness and/or lack of direction.
Features
All colors customizable
Toggle display of indecision areas
Adjust levels considered strong, weak trends
Which markets is this meant for?
This can be used in any market, though it’s recommended to use with liquid markets where direction and strength can be found often.
What conditions?
Recommend to utilize with key levels and most commonly utilized moving average periods such as 20, 50, 100 or 200.

Ichimoku Buy/Sell Signals of manual MTF Tenkan crossing KijunIchimoku Buy/Sell Signals based on fast, small time frame Tenkans crossing longer timeframes Kijuns - Manual MTF Analysis
This code marks the potential change of direction based on the input of one timeframe's Ichimoku Tenkan (conversion) line crossing over a higher, longer timeframe's Ichimoku Kijun (base) line.
Feel free to change the inputs if need be and to hide the yellow box. Use Ichimoku rules of Tenkan, Kijun, Lagging Span, and Cloud for Take profit/Stop Losses. It is best to wait 3-5 minutes after the signal to enter to confirm the trend and to confirm if the Lagging Span has broken key levels. I refer to the book Trading with Ichimoku - A Practical Guide to Low-Risk Ichimoku Strategies by Karen Peloille as the Ichimoku rulebook. Good luck.
For day trading/scalping/intraday - 1min/3min/5min
Tenkan Line Timeframe = 1min
Kijun Line Timeframe = 5min
For swing trading - multiple days/weeks - 4HR/Daily/Weekly Charts
Tenkan Line Timeframe = day
Kijun Line Timeframe = week

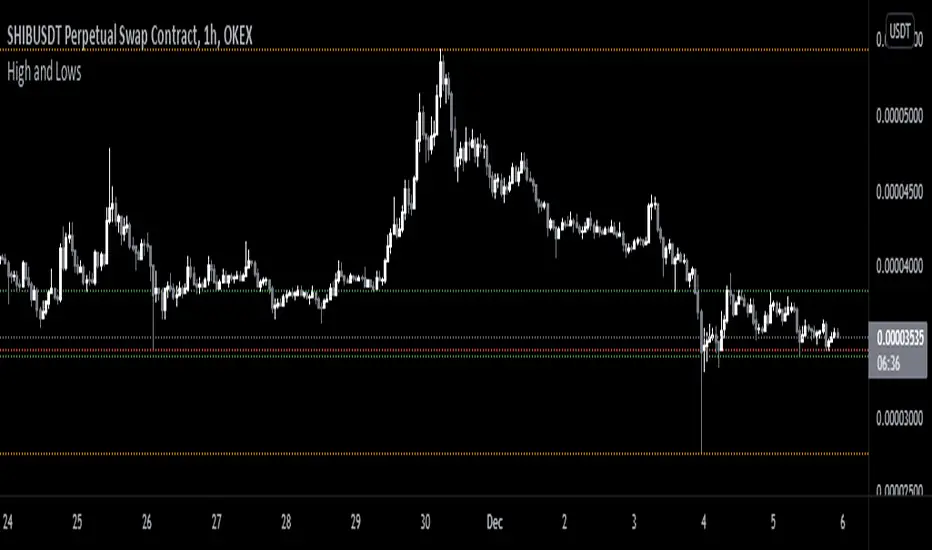
Monthly/Weekly/Daily/High and LowsSimple script that marks the prior month/week/day highs and lows for finding key levels.
SupportResitanceAndTrendLibrary "SupportResitanceAndTrend"
Contains utilities for finding key levels of support, resistance and direction of trend.
superTrendPlus(multiple, h, l, atr, closeBars) A more flexible version of SuperTrend that allows for supplying the series used and sensitivity adjustment by confirming close bars.
Parameters:
multiple : The multiple to apply to the average true range.
h : The high values.
l : The low values.
atr : The average true range values.
closeBars : The number of bars to confirm a change in trend.
Returns:
superTrend(multiple, period, mode, closeBars) superTrendPlus with simplified parameters.
Parameters:
multiple : The multiple to apply to the average true range.
period : The number of bars to measure.
mode : The type of moving average to use with the true range.
closeBars : The number of bars to confirm a change in trend.
Returns:
stochSR() Identifies support and resistance levels by when a stochastic RSI reverses. Returns:

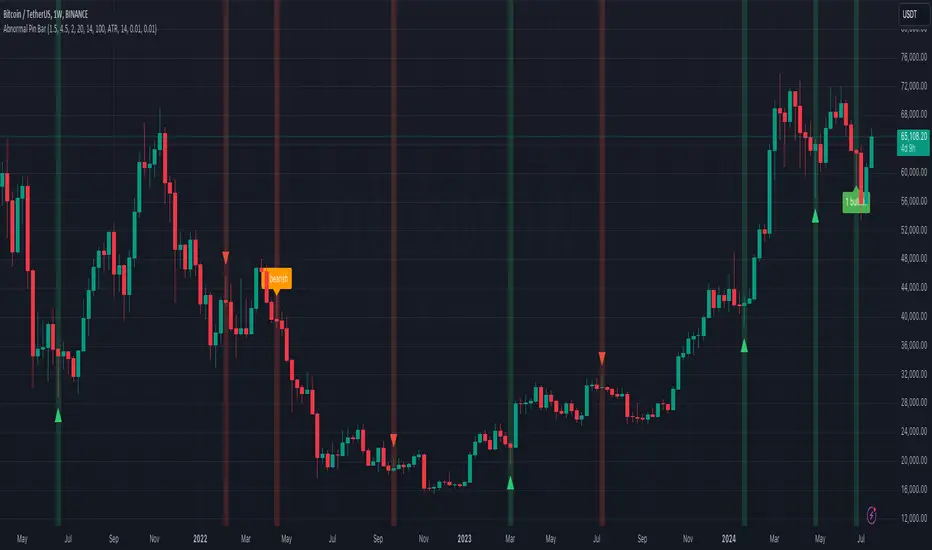
Abnormal Pin BarPin Bar is one of the most important candlestick patterns. Almost every time you see a pin bar, you can expect the price to turn in the opposite direction.
You should pay more attention to the abnormal ones among the pin bars. What I mean by abnormal pin bar is that the long leg is at least 3 times larger than the body.
With this indicator, you can set your own abnormal pin bar settings. The indicator will highlight abnormal pin bars according to the settings you specified.
The indicator uses the following three factors to indicate abnormal pin bar:
- Minimum body ratio in the pattern in percent
- Minimum ratio of the long shadow to the body
- Minimum ratio of the long shadow to the short shadow
Also, there is a volume strength check to confirm the pin bar. If the volume where the pin bar is formed is greater than the 20 volume average, it indicates that the pin bar is more important. Of course, confirming the pin bar with the volume is optional and you can disable it in settings if you wish.
You can use the highlights of this indicator as an entry signal if the pin bar appears at the trend key levels or in support or resistance zones.
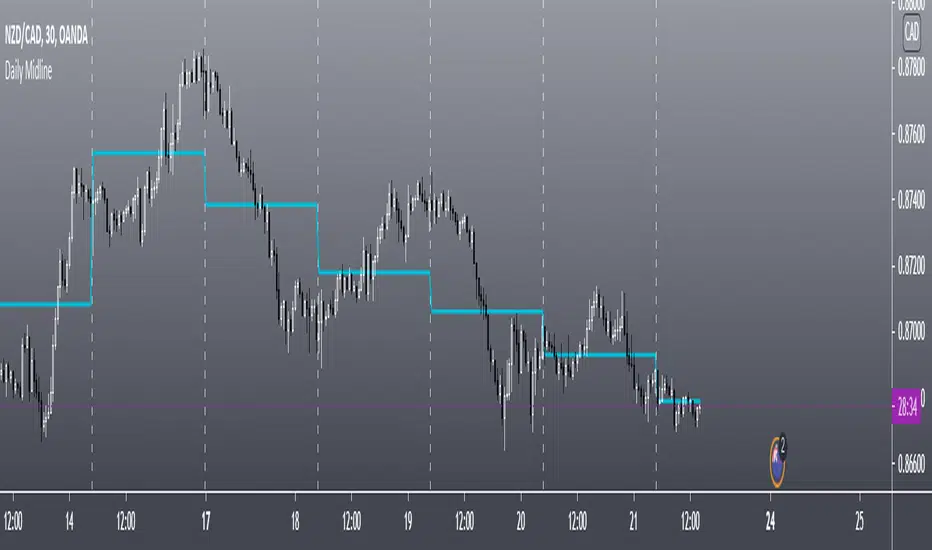
Daily MidlineThis Scripts Shows Daily Midline Levels From Yesterday High/lows.
Credits to rodrigo.aprieto and NorthstarDaytrading
for combined script idea.
Rain On Me V2As promised, here is Rain On Me Indicator V2! As the name suggests, this indicator will rain money down on you. More seriously, Rain On Me V2 is a complete overhaul of the V1.
For those who are new to this indicator or for those who already knew it, here is a complete description of this indicator.
This indicator contains:
-Fully configurable multi-timeframe buy or sell signals based on ATR with the possibility to set the period, deviation, period of the ATR and choose the source or type of signals: RMA, SMA , EMA, WMA, VWMA, SMMA, KMA, TMA, HullMA, DEMA, TEMA, CTI.
-Colouring of candles on ATR. (green and red).
-Buy or sell signals with VPT (based on st_dev) with the possibility of adjusting the period and the multiplier. (Only works in markets with available volume information flows).
-Trend Parabolic SAR (Up / Down) fully configurable.
-Divergences with the possibility of choosing among the following signals: MACD, OBV, RSI, CCI.
-3 Moving averages with the possibility of choosing their values and their type for each one: SMA, EMA, RMA, WMA, VWMA. (default: WMA 1 = 7, WMA 2 = 21 and SMA 3 = 50).
-Fibonacci on 10 levels with level 0 in the middle. This Fibonacci helps a lot as it can make it easy for you to find an entry / exit point, a trend and even where to place your Take Profit and Stop Loss.
-Fully customizable Bollinger Band.
-Fully customizable Ichimoku cloud.
-Multi-timeframe Trendline that tells you the true trend of the current market based on volume. (Only works in markets with available volume information flows). It can change from green (for an uptrend) or red (downtrend) color.
To place an alert, always choose the "Once per bar" option.
You can place alerts on the following options:
-GO Buy / GO Sell (ATR).
-VPT Buy / Sell.
-PSAR (Up / Down).
-Divergences (Bullish / Bearish).
-Crossing of moving averages 1 and 2.
-Fibonacci key levels (0.382, 0.5 and 0.618) for Crossunder and Crossover in an uptrend or downtrend.
You can choose to show or hide from the chart all the options mentioned above.
Never follow buy or sell signals stupidly. Always watch that all the indicators are going in the same direction, that you are not in a range zone, that there is no resistance etc ...
Always wait for confirmation after a buy or sell alert before entering a position to make sure the label stays on the chart and doesn't disappear.
Please feel free to give your ideas, suggestions or bug reports in the comments area to help me improve it.
A BIG THANKS TO QUANTNOMAD FOR GIVING ME ITS AUTHORIZATION TO USE, MODIFY AND REPUBLIC ITS "Ultimate Pivot Points Alerts" script indicator:
Good trade everyone! And remember, money management is the most important!
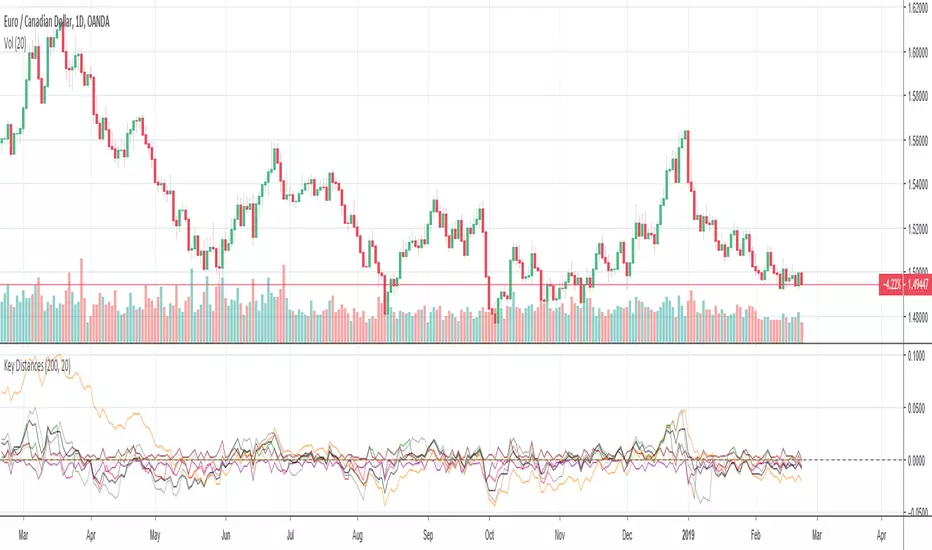
Key Distances (Weekly, Daily Open, & EMA)This indicator provides the pip value from various key levels I've found important in my trading system.
The results are graphed. I suggest that you choose the 2 most important ones you want to graph otherwise the indicator gets difficult to read.
The important data is the actual numbers but I've found it helpful to understand how a ticker moves in regards to weekly open and distance from 200EMA to be most helpful.
Here is the order of the data listed:
Distance from weekly open (green if above open, red if below open, also paints color on line)
Distance from last week opening price
Distance from daily open
Distance to 200EMA
Future Possible Updates:
- customized EMA
- Distance from weekly low/high
Time Pressure ZonesTime Pressure Zones is a multi‑purpose candle and volume‑based indicator that highlights moments when markets are likely being driven by urgency rather than routine trading flow.
**Overview**
Detects sequences of strong, one‑directional candles accompanied by volume spikes to approximate institutional time pressure (forced buying or selling).
Paints subtle background zones, labels, and a net‑pressure histogram so you can see when aggressive flow is building or exhausting across any instrument and timeframe.
**Core Logic**
A bar is tagged “strong” when its real body occupies at least a user‑defined percentage of the full high‑low range, filtering out indecision candles and long‑wick noise.
Volume is compared to a rolling 20‑bar average; only bars with volume above a configurable multiple are treated as meaningful participation, which makes the tool adapt to different symbols and sessions.
The script counts consecutive bars that are both strong and high‑volume in the same direction, then flags a time‑pressure event once a set fraction of the lookback has been reached (e.g., 2 out of 3, 3 out of 5).
**Visual Outputs**
Background shading: green or red bands mark active bullish or bearish time‑pressure windows without overpowering other tools on the chart.
On‑chart labels: “↑ Time Pressure” and “↓ Time Pressure” appear only on the first bar of a new pressure sequence, ideal for alerts and discretionary entries.
Net Pressure histogram: plots the difference between bullish and bearish streak counts, giving a quick at‑a‑glance sense of which side currently dominates.
**Sessions and News**
Uses UTC‑based logic to highlight London and New York open and close windows, where institutional flows and intraday “deadline” behavior tend to cluster.
Includes a manual News Window toggle so you can mark high‑impact event periods (CPI, FOMC, NFP, etc.), aligning tape‑based urgency with scheduled catalysts.
**How To Use**
Look to join moves when fresh time‑pressure labels print into session opens, breakouts, or key levels, rather than fading them.
Tune the three main inputs per market and timeframe: lower thresholds for choppy or thin markets, and higher body/volume requirements for very liquid symbols like major indices or BTC pairs.

eBacktesting - Learning: Liquidity GrabseBacktesting - Learning: Liquidity Grabs highlights moments when price pushes just beyond a recent swing high or swing low (where many stops tend to sit) and then quickly returns back inside the level. This behavior is often called a stop run, sweep, or liquidity grab.
Traders study these events because they can reveal:
- Where liquidity is “resting” (obvious highs/lows)
- A quick sweep and rejection (often a wick)
- When a breakout attempt is actually a trap
- A full candle close through the level, followed by an immediate reversal back inside (classic breakout trap)
- Potential areas where price may reverse or accelerate after stops are taken
Use it as a training tool to build pattern recognition and improve your patience around key levels, especially during active sessions where sweeps happen frequently.
These indicators are built to pair perfectly with the eBacktesting extension, where traders can practice these concepts step-by-step. Backtesting concepts visually like this is one of the fastest ways to learn, build confidence, and improve trading performance.
Educational use only. Not financial advice.

***CILGIN INDIKATOR***ÇILGIN INDICATOR – User Guide
OVERVIEW
ÇILGIN INDICATOR is a multi-layer trend and momentum confirmation tool designed for discretionary traders.
It combines Relative RSI, EMA structure, SuperTrend logic, Momentum, and optional CCI & ADX filters into a single visual system.
Purpose:
Filter market noise, confirm trend strength, and highlight high-probability Buy / Sell zones.
The indicator works on all symbols and all timeframes.
RELATIVE RSI & MOMENTUM
The indicator can work in two modes:
NORMAL MODE (Formula OFF)
RSI is calculated directly from the chart symbol.
FORMULA MODE (Formula ON)
RSI is calculated from a relative price formula:
Base Symbol / Denominator 1 / Denominator 2
This allows relative strength analysis against indices, sectors, or benchmarks.
RSI SIGNAL LOGIC
RSI Signal Line = SMA of RSI
RSI 50 Level = Trend bias reference
BUY SIGNAL
RSI crosses above the signal line
Optional: RSI must also cross above 50 (Double Confirmation)
SELL SIGNAL
RSI crosses below the signal line
Optional: RSI must also cross below 50
Small arrows on the chart represent RSI-based Buy and Sell signals.
EMA STRUCTURE
Five adaptive EMAs are plotted: EMA 1
EMA 5
EMA 21
EMA 50
EMA 100
EMA lengths automatically adapt to timeframe speed.
EMA BUY LOGIC
Fast EMA crosses above any slower EMA.
EMA SELL LOGIC
Fast EMA crosses below any slower EMA.
EMAs define:
Trend direction
Dynamic support and resistance
Momentum shifts
SUPERTREND SYSTEM
A custom ATR-based SuperTrend is used.
Features:
Optional candle wick usage
Dynamic trailing stop
Visual Buy / Sell labels
SUPERTREND BUY
Trend flips from bearish to bullish.
SUPERTREND SELL
Trend flips from bullish to bearish.
Colored zones visualize the active trend direction.
STRONG BUY & STRONG SELL SIGNALS
A Strong Signal is generated only when multiple conditions agree.
STRONG BUY
RSI Buy Signal
SuperTrend Buy Signal
Optional CCI Filter confirmation
Optional ADX Filter confirmation
STRONG SELL
RSI Sell Signal
SuperTrend Sell Signal
Optional CCI Filter confirmation
Optional ADX Filter confirmation
Strong signals are displayed as large labeled markers: “STRONG BUY”
“STRONG SELL”
Designed for trend-following entries, not market noise.
CCI & ADX FILTERS (OPTIONAL)
CCI FILTER
Buy allowed only if CCI > 0
Sell allowed only if CCI < 0
ADX FILTER
ADX must be above minimum level
Direction confirmed using +DI and -DI
These filters help avoid sideways markets and weak trends.
INFORMATION PANELS
PANEL A (Top Right)
Daily percentage change
Weekly percentage change
Monthly percentage change
Daily volume (millions)
PANEL B (Bottom Right)
Relative RSI value
RSI signal value
Relative momentum
Market status (Bull / Bear)
Provides instant market context without extra indicators.
ALERTS
Built-in alerts are available for:
STRONG BUY
STRONG SELL
Suitable for automation and watchlist monitoring.
BEST PRACTICES
Use Formula Mode for relative strength analysis
Enable CCI & ADX filters on higher timeframes
Combine signals with price action and key levels
Do not use as a standalone trading system
DISCLAIMER
This indicator is a decision-support tool and does not provide financial advice.
Always manage risk and confirm signals with your own analysis.

WaveRider [Scalping-Algo]# 📊 TrendPulse Pro - Indicator Guide
## 🎯 What is it?
A clean all-in-one trend tool. Combines 4 smoothed MAs, candlestick patterns & session highlights. No clutter, just signals.
---
## 🔧 Features
### 📈 4 Smoothed Moving Averages
- **21 SMMA** (Cyan) → Fast trend, scalping
- **50 SMMA** (Green) → Swing entries
- **100 SMMA** (Gold) → Medium trend filter
- **200 SMMA** (Red) → Major trend direction
💡 *Price above all = strong bull. Below all = strong bear.*
---
### ⚡ 3 Line Strike Pattern
Rare but powerful reversal signal.
- 🟢 **Bull 3LS** → 3 red candles + 1 big green that closes above first candle
- 🔴 **Bear 3LS** → 3 green candles + 1 big red that closes below first candle
💡 *Best near support/resistance zones.*
---
### 💎 Engulfing Candles
Shows momentum shift.
- 🟢 **Bull Engulf** → Green candle swallows previous red
- 🔴 **Bear Engulf** → Red candle swallows previous green
💡 *Filter with trend direction for better win rate.*
---
### 🕐 Session Highlight
See your trading window clearly.
- Light shade = Pre-session (prep time)
- Darker shade = Active session (go time)
💡 *Default is CME hours. Adjust in settings.*
---
## 📝 Quick Setup
1. Add to chart
2. Pick your timeframe (works on any)
3. Toggle what you need ON/OFF
4. Set your session times
5. Trade with confidence
---
## 🎨 Color Guide
| Element | Default Color | Meaning |
|---------|---------------|---------|
| 21 MA | Cyan | Fast trend |
| 50 MA | Green | Swing trend |
| 100 MA | Gold | Filter |
| 200 MA | Red | Big picture |
| Fill Green | Light Green | Bullish bias |
| Fill Red | Light Red | Bearish bias |
---
## ⚠️ Tips
✅ Use MA stack for trend bias
✅ Wait for patterns AT key levels
✅ Combine with volume
✅ Respect the 200 MA
❌ Don't trade against all MAs
❌ Don't chase every signal
❌ Don't ignore session times
---
## 🚀 Best Practices
**For Scalping:**
- Focus on 21 & 50 MA
- Trade engulfing patterns
- Use 1-5 min charts
**For Swing:**
- Focus on 100 & 200 MA
- Trade 3 Line Strike
- Use 1H-4H charts
---
Made with ☕ by a trader, for traders.
*"Keep it simple. Let price do the talking."*

Intermarket Divergence (Futures vs Equity)Intermarket Divergence (Futures vs Equity)
This indicator detects intermarket divergence between a traded instrument (futures, CFD, or spot) and a related equity or ETF.
It highlights moments where price and its underlying market drivers disagree, often appearing before reversals or expansions.
🎯 What It Shows
Bullish divergence:
Price makes a lower low while the equity makes a higher low
Bearish divergence:
Price makes a higher high while the equity makes a lower high
Based on swing pivots, not candle noise
Designed for intraday context, not mechanical entries
✅ Recommended Use
XAUUSD (Gold) → GDX (default)
XAGUSD (Silver) → SIL
USOIL / WTI → XLE
(These guidelines are included directly in the indicator settings.)
🧭 How to Use
Apply on 15m–30m
Look for signals near key levels (PDH/PDL, Asia high/low, HTF structure)
Use price action for entries
Divergence is context, not a signal.
⚠️ Notes
Non-repainting
Signals are selective by design
Best during London & New York sessions

Simple PDH / PDL Clean Entries (NZ Time)Simple PDH / PDL Liquidity Entry Indicator
This indicator is designed for clean, stress-free intraday trading on Gold. It identifies high-probability buy and sell opportunities based on a liquidity sweep and reclaim of the previous day’s high or low (PDH / PDL). Signals are limited to one trade per session using New Zealand time, helping prevent overtrading. Each signal prints a clear BUY or SELL icon directly on the candle, along with a concise label showing entry price, stop loss, and take profit. No indicators, no clutter — just key levels, disciplined execution, and institutional-style simplicity.

Liquidity Hunter: Stop Hunts & Volume ClustersStop Hunt Wick Detection
What it catches:
Wicks that are 2x+ larger than the candle body (adjustable)
Minimum wick size to filter out noise
Optional volume confirmation (stops hunts usually have higher volume)
Marks bullish stop hunts (long lower wicks) with 💎 and "BUY LIQ"
Marks bearish stop hunts (long upper wicks) with 💎 and "SELL LIQ"
Extends dashed lines showing where liquidity was grabbed
Volume Cluster Detection
What it tracks:
Bars with volume 1.5x+ above average (adjustable)
Automatically merges nearby clusters within 3 bars
Shows different colors based on volume intensity:
Yellow = 3x+ average volume (extreme)
Orange = 2x+ average volume (strong)
Blue = 1.5x+ average volume (moderate)
Draws horizontal zones showing where volume accumulated
Labels show the volume multiplier (e.g., "VOL: 2.3x")
Adjustable Settings
You can tune:
Wick-to-body ratio threshold
Minimum wick size percentage
Volume confirmation requirements
Cluster sensitivity and merge distance
The theory: Stop hunts grab liquidity above/below key levels, then price reverses. Volume clusters show where institutions accumulated positions. Both mark areas price is likely to revisit.
Try it out and let me know what needs tweaking!

Trend Speed Analyzer with Entries (Zeiierman)📈 Trend Speed Analyzer with Entry Signals (Zeiierman – Modified)
🔹 Overview
This indicator is a trend-following momentum system built around an adaptive (dynamic) moving average and a proprietary trend speed / wave strength engine.
It is designed to identify high-quality continuation entries after price confirms direction, not to predict tops or bottoms.
Best suited for:
Index futures (ES, NQ)
ETFs (SPY, QQQ)
Strongly trending stocks
Intraday or swing trading
🔹 Core Concepts
1️⃣ Dynamic Trend Line (Adaptive EMA)
Instead of using a fixed EMA length, this script dynamically adjusts:
EMA length based on normalized price movement
EMA responsiveness using an accelerator factor
Result:
Fast reaction during strong trends
Smooth behavior during choppy markets
Fewer false flips compared to traditional EMAs
This trend line acts as the primary regime filter.
2️⃣ Trend Speed & Wave Analysis
The indicator tracks trend speed, which represents cumulative directional pressure over time.
It also records:
Bullish wave sizes
Bearish wave sizes
Average vs maximum wave strength
Bull/Bear dominance
These statistics are displayed in an optional table to help assess:
Market bias
Momentum asymmetry
Whether the current move is weak, average, or exceptional
🔹 Entry Signal Logic (One Signal per Trend Shift)
Signals are not spammy.
Only one entry signal is allowed per crossover.
Long Entry Conditions
A long signal is generated when:
Price crosses above the dynamic trend line
A bullish candle forms
The candle body is at least X% of ATR (filters weak/doji candles)
The entire candle body is above the trend line
(Optional) Trend speed is positive
Short Entry Conditions
A short signal is generated when:
Price crosses below the dynamic trend line
A bearish candle forms
The candle body is at least X% of ATR
The entire candle body is below the trend line
(Optional) Trend speed is negative
📌 Once a signal fires, no additional signals will appear until a new crossover occurs.
🔹 What this indicator is NOT
❌ Not a mean-reversion system
❌ Not a prediction tool
❌ Not meant for sideways markets
This tool assumes structure → confirmation → continuation.
🔹 How to Trade It (Suggested Use)
Use higher timeframes (5m–30m) for cleaner signals
Trade in the direction of higher-timeframe bias
Combine with:
VWAP
Key levels (PDH / PDL / PMH / PML)
Market session context
🔹 Customization
Adjust Maximum Length for smoother vs faster trends
Adjust Accelerator Multiplier for sensitivity
Enable/disable speed filter for stricter momentum confirmation
ATR candle filter removes weak signals automatically
⚠️ Disclaimer
This indicator provides technical signals only and does not include trade management, stops, or targets.
Always apply proper risk management.

Reversal Candlestick PatternsReversal Candlestick Patterns
Reversal Candlestick Patterns is an indicator designed to detect classic candlestick reversal patterns with additional market context filtering.
The indicator identifies ten well-known reversal candlestick patterns and displays them directly on the chart as visual blocks. Each pattern is detected using its own logic, based on candle structure, position relative to local extremes, and the direction of the current trend.
Bullish patterns:
> Bullish Engulfing
> Morning Star
> Hammer
> Inverted Hammer
> Three White Soldiers
Bearish patterns:
> Bearish Engulfing
> Evening Star
> Hanging Man
> Shooting Star
> Three Black Crows
Pattern configuration
Detection of each individual pattern, its short name displayed on the chart, and the color of the highlighting block can be configured separately in the first two settings groups:
Bullish Patterns and Bearish Patterns .
This allows you to fully customize which patterns are used, how they are labeled, and how they are visually represented.
Trend filtering
The indicator includes an optional trend filter based on two Simple Moving Averages.
It is enabled using the Check Trend setting. The Trend Detection Length parameter is used simultaneously for several calculations:
> Length of the fast moving average
> Half of the slow moving average length
> Number of consecutive bars required to confirm trend direction
This approach helps filter out reversal patterns that form against a well-established trend.
External filters
The indicator supports external confirmation filters for bullish and bearish patterns. External filter settings are located in the External Filters group. For each filter, you can specify the value of an external indicator that must be met for a pattern to be confirmed. This allows flexible integration with oscillators, volume-based indicators, or custom scripts.
Visualization settings
Visualization settings control:
> Pattern name display
> Text size
> Block fill transparency
These settings affect only the visual presentation and do not influence the detection logic.
Alerts
The indicator provides two types of alerts:
1. Global alert for any detected pattern. Created by selecting “Any alert() function call” when setting up an alert.
2. Dedicated alert conditions for:
> Each individual pattern
> Any bullish pattern
> Any bearish pattern
Please note: if detection of a specific pattern is disabled in the settings, alerts for that pattern will not trigger.
Important note
Candlestick patterns should not be used as standalone trading signals. This indicator is intended to be used as part of a broader analysis, together with trend structure, key levels, volume, and other analytical tools.

FPT - Harami FPT – Harami (Wick Included) is a clean and minimalist candlestick pattern indicator that highlights Harami reversal formations using full candle ranges (wicks included).
This version follows a strict and objective definition of Harami by requiring the entire range of the second candle (high–low) to be fully contained within the range of the first candle.
🔹 Patterns Detected
Bullish Harami
First candle: Bearish
Second candle: Bullish
Second candle’s high and low are completely inside the first candle’s range
Bearish Harami
First candle: Bullish
Second candle: Bearish
Second candle’s high and low are completely inside the first candle’s range
Only the pattern-forming candle (second candle) is highlighted to keep the chart clean and focused.
🎨 Customization
Highlight Bullish, Bearish, or Both Harami patterns
Separate and fully customizable colors for bullish and bearish patterns via Inputs → Colors
Style tab colors are intentionally not used
🎯 Design Philosophy
No indicators
No filters
No assumptions about trend or volatility
This tool is designed for traders who prefer pure price action and want to identify Harami patterns in combination with:
Key levels
Support & resistance
Market structure
Session-based or discretionary analysis
⚠️ This indicator is for visual analysis only and does not provide trade signals.
Always apply proper risk management.

FPT - Dark Cloud & Piercing FPT – Dark Cloud & Piercing (GAP) is a minimalist candlestick pattern indicator designed to highlight classical two-candle reversal formations with strict gap requirements.
This tool focuses purely on price action and avoids unnecessary filters or conditions.
🔹 Patterns Detected
Bullish Piercing Line
First candle: Bearish
Second candle: Bullish
Second candle opens with a gap down
Close penetrates above the midpoint of the first candle’s real body
Does not fully engulf the first candle
Bearish Dark Cloud Cover
First candle: Bullish
Second candle: Bearish
Second candle opens with a gap up
Close penetrates below the midpoint of the first candle’s real body
Does not fully engulf the first candle
Only the pattern-forming candle (second candle) is highlighted to keep the chart clean and readable.
🎨 Customization
Enable Bullish, Bearish, or Both patterns
Fully customizable colors for each pattern via Inputs → Colors
Style tab colors are intentionally not used to avoid confusion
🎯 Design Philosophy
No indicators
No volatility or size filters
No trend assumptions
Just pure candlestick structure, exactly as defined in classical technical analysis.
This indicator is ideal for traders who combine:
Key levels
Supply & demand zones
Market structure
Session-based or discretionary analysis
⚠️ This indicator is a visual tool only and does not provide trade signals by itself.
Always use proper risk management.
